Saturday, August 12, 2023

MAUI CONFLAGRATION—TRAGIC RESULTS OF WEATHER AND GEOGRAPHY

 August 11, 2023


The Maui Fires were a result of a concatenation of weather and geographic phenomena: Hurricane Dora, El Nino weather, 60 MPH winds, steep slopes, narrow windy canyons, adiabatic heated dry air, seasonally dry brush-lands, vulnerable electric utility poles, limited coastal roads, poor disaster preparation, and over population.  


The tragic fires on the Island of Maui have killed at least 60 people, with over 1,000  still missing. The conflagrations burned about 80% of the city of Lahaina, located on the north west coast that island.  This tragic WEATHER event like so many other recent normal atmospheric  phenomena has been grasped by the climate propagandists as additional  “evidence” used to advance their political, and self-serving agendas.  Too many of these folks are willing  to sacrifice scientific rigor for a cheap form of self-aggrandizement. Others are part of the lucrative “climate science” “cottage industry” which actively label every unusual or exceptional atmospheric  event or phenomena a “sure sign” of cataclysmic anthropogenic global warming or climatic change. 


Of course these “propaganda practitioners” gain immediate notoriety as a result of their wild unsubstantiated claims, which attract the uninitiated who read their exaggerated reports, build up the “hits” they get on their posts, and perhaps their efforts result  in a new government contract, a promotion to “Associate Prof”, or a lucrative  government grant.  Yes, our most recent government is in collusion with these practitioners too.        


So I am driven to correct the misinformation regarding this tragedy and put the facts out there for all to read.  


Maui is a fifty mile long and twenty-six mile wide  volcanic Island in the Hawaii archipelago.  Maui is the result of the emergence from the sea bed of two extinct shield-cone volcanoes, both of which are over 1.3 million years old.   As all the islands in the chain, Maui was generated by a “hot spot” in the mantle of the Earth over which the Pacific crust has been moving for many millions of years.  After Hawaii, the youngest and “big island”, Maui follows next in line. The chain, which stretches out to the northwest, consists of  Molokai, Oahu, Kaui, and the most northerly and smallest, Ni’ihau.   


Maui island is shaped like a figure “8” which is somewhat tilted to the northwest.  The island was formed by the eruption and emergence of two volcanoes from the sea bed at slightly different times. The smaller, older, western volcano is Mauna Kahalawai (or “West Maui Mt”) with a summit at 5800 feet, it forms the top of the figure “8”.  Mauna Kahalawai is an extinct volcano which last erupted more than one million years ago.  Ironically, the summit of this volcano is one of the wettest places on Earth, accumulating nearly 10 meters (@ 30 feet) of rain (or almost 394 inches) each year.  The torrents of rain flowing down the steep-sided volcanic slopes of Kahalawai have deeply eroded the volcanic rock, dissecting it into numerous deep valleys and canyons.  Several of these erosion features are directed toward and terminate near the city of Lahaina, only twenty miles away, and one of the driest places on the island—a virtual desert—where only 0-8 inches of rain fall annually. It is also the oldest city on the Island and in the chain . 


The larger south eastern part of the island (base of the “8” ) is formed from the emergence of Haleakala volcano (10,023 feet).  The island is in the zone of the NE Trade Winds which bathe the island in near constant, moist pleasant and temperate sea winds.  


Maui’s  climate and rainfall amounts are heavily affected by the NE Trade Winds which provide a near continuous  flow of semi tropical to tropical marine air masses over these lovely islands. Rainfall on Maui varies over the year— the summer and fall being the driest part of the year.   Sea temperatures around the islands range in the high seventies Fahrenheit year round.  In the well buffered marine environment, air temperatures  do not change much annually.  In Maui, sea temperatures range  from 75 F to 80 F all year round, and have a direct influence on island air temperature. 


Also rainfall varies in the extreme from one side of the island to the other.  This fact is due to mountainous nature of Maui, the persistence of the NE Trade Winds and the high levels of moisture in the air of the north central Pacific Ocean.  The windward side of the island may get 200 to 400 inches (20-30 feet)of rain each year, while the leeward (downwind side) may be a desert receiving only 0-8” per year.  The reason for this is that as air is forced up and over a high mountain such as Haleakala and Kahalawai as the air is forced upward it cools, its moisture condenses into clouds, and precipitation falls to earth.  This air is lower in moisture  and as it descends on the leeward side of the mountains it heats up (by adiabatic rate of 5.5 F/1000 feet). Its relative humidity falls drastically. As a result of this (mountain) orographic effect, the leeward side of Maui, where Lahaina is located, is essentially a desert climate with less than ten inches of rain per year.  


The vegetation to the east of the city, on the slopes of Kahalawai is dominated by various species of grass and brush. Most of this vegetation grows during the rainy winter and then dies during the hot dry summer. . See https://earth.app.goo.gl/SBb91N. Lahaina bypass. 


The region along the northwest coast near Lahaina  is in a naturally-dry desert area with just enough winter rain for grass and brush to grow in the wet season. But it dies back each year during the dry season. This area is prone to common grass and brush fires.  


As would be expected, it is in the  narrow belt of land in the desert area, close to the shore, where most urban development has taken place. Lahaina City is located in this area.  


In addition, the geography of this developed area, limited by the sea shore and  mountainous terrane permits  only a narrow zone in which roads can serve this region.  Although the modern Lahaina “by pass” does just that passes east of the city over higher land. 


Typhoons and hurricanes normally pass close to the island chain. In August, of this year Hurricane Dora formed just southwest of the Hawaiian chain.


Furthermore, at the present  time, the region of the east Pacific Ocean is experiencing El Nino weather. El Nino is a weather phenomenon which tends to increase hurricane development and intensity in the Pacific region. Hurricane Dora which passed several hundred miles south of the island chain generated winds in excess of 74 miles per hour which had an enormous effect on the wild fires on Maui.


In addition, a powerful high pressure center had developed just north of the chain.  The high pressure produced a strong clockwise flow of air, while Dora was generating very strong counter-clockwise winds just to the south of the Hawaiian chain. The result was an “egg beater” atmospheric effect— which generated very strong north-easterly winds with Maui near its center. Winds associated with Dora were clocked at over 60 miles per hour (100km per hour) just east of the islands 


The “twin mountain” profile of Maui presented to these powerful storm winds tended channel the air flow between two high mountains of Mauna Kahalawai and Haleakala. Wind speeds would have increased considerably in this region as it ws forced though the mountqin pass. This contributed heavily to inrease wind speeds in Lahania. 


In addition,  strong winds surging up and over Mouna Kahalawai then down onto the leeward side of that mountain were likely channelled into the canyons and deep valleys of Kahalawai’s heavily eroded west slopes. In this confined environment wind speed may have intensified as well. In addition, as the air descended from elevation to the sea level, it heated by the dry adiabatic lapse rate (5.5 F/1000 ft).  Air heated in such a manner loses moisture and as temperature rises, its relative humidity falls to very low levels. These atmospheric effects combined to generate exceptionally  hot, dry high speed winds over Lahania. The near perfect circumstances for a tragic fire storm.


Thus storm winds flowing down slope from near six thousand feet to sea level and being channeled by the erosion gullies on the west slopes of Kahalawai were likely flowing at speeds well over 60 miles per hour and were extremely hot and dry as they streamed toward Lahaina. 


Winds of this speed and force can easily down electric utility poles. As these fall wires break and short out creating sparks which generate fires. The fires were fanned and driven westward by high winds, and very hot dry air to form the awful  conflagration that incinerated the city.  Many fires on Maui may have been initiated this way. 


In the event lf high speed, dry hot winds almost any outdoor fires of any kind, a tossed cigarette, a barbecue fire, or human carelessness can flare up info a blaze that spreads and quickly becomes a conflagration. 


The tragedy on Maui is a perfect storm of weather and geographic circumstances having little or nothing  to do with climate change. 


Wednesday, August 2, 2023

BIDEN ECONOMY INDICTED BY FITCH RATINGS FOR MALFEASANCE

 2 AUGUST 2023


Fitch Ratings downgraded US Treasury Bonds from its top level Triple “A” down to only double “A”.   


The mess that President Biden has spawned across our nation seemingly has no end. From one coast to the other Joe has revealed his anti-Midas touch—everything he touches turns, not to gold, but to something unpleasant that smells bad.  


Today,  under Mr. Biden, we are all unhappy with rising prices,  with high rates of borrowing, and with our inflated currency.  We are fearful of the war in Ukraine,  of the crisis at the southern border, the illegal immigrant invasion into our cities, high crime rates, worsening race relations and pervasive lack of optimism in our society.  Simply put: “Things ain’t going right”.  


How did this happen?  President  Biden’s very first policy decisions, kneecapped  a flourishing economy by unwisely and unnecessarily crippling the fossil fuel industry—the source of an ubiquitous commodity essential for almost every component of our economy. The immediate result was rampant high fuel prices. The surge in gasoline and diesel combined with supply chain problems and critical shortages, as well as Biden’s excessive and irresponsible domestic spending, all fueled a massive spurt of inflation— a crisis the nation had not experienced in 40 years. 


Inflation is a problem that still plagues us. Today,  gasoline prices have again surged over the last week by as much as 40-50 cents per gallon, locally.  Core inflation still stands at well over 4%.  But as too many forget—inflation is cumulative—each month it stays high we all lose more buying power. Over the last three years we have all lost tens of thousands of dollars in the value of our savings, our pay checks and our buying power as a result of Joe’s irresponsible mishandling of the economy. 


Of course the President, his handlers, and most egregiously the main stream media, will not  reveal these unflattering developments as they attempt to “repackage”  this unsuccessful, failing, faltering, aging president for a second disastrous term in office.  For this self-serving reason—and somehow ——speaking with a straight face—- they continue to falsely claim that the Biden “economy” is doing just fine.  But as we struggle in a nation in obvious, painful decline, we know with certainty as we try to pay our bills at the super market or the gas station— that they lie. 


Fortunately, the economists and analysts at Fitch Ratings do not do “propaganda”.  Economics— the most rigorous of the social sciences—some call the “queen of the social sciences”—is by need and design,  divorced from bias and political propagandizing.  Economists  have to toe to the “bottom line”—which is to  mathematically  determine if  some asset is profitable or not


Which brings me to the important news of this day; (Not President Trump’s indictment.) but the Fitch Ratings Report which has justifiably indicted the Biden Administration for economic malfeasance.  


Fitch Ratings has determined —for the first time in its history—that US treasuries can no longer be rated at the top triple A (AAA) level considered the “gold standard” and the safest possible investment. 

Fitch downgraded US notes  to the AA level.  


Fitch Ratings cites as their reasons:


 “a steady deterioration in standards of governance, 

political dysfunction, 

high debt, 

deteriorating finances, 

sharp political divisions, 

growing debt burden, 

and likelihood of a recession” .   


This downgrade has wide-ranging effects, from increasing mortgage rates borrowers must pay, to increased costs in international contracts that the US makes across the world.  


But the greatest impact is on US borrowing costs. Since the US government habitually spends so much more than it receives in taxes each year, our borrowing costs will go up.  Forced now to sell bonds of AA rate will require us to pay investors in treasury notes a higher interest rate. Borrowing will be more expensive. 


Does this sound like the “great economy” that the Biden propagandists have been touting?  I think not.


The fact is that the US must sell bonds to make up the difference between the received tax revenue versus the amount the Biden Administration has spent for this year.  


Joe has spent government cash like a sailor on shore leave. This year of 2023 Biden has spent $1.6 trillion dollars more than we received in taxes.  His billion dollar plans to pay off student loans, his unconscionable and laughable  “Inflation   Reduction Act” which was a stimulant to more  inflation,  and his inhumane and irresponsible open ended handouts  of more of than $44 billion dollars to the corrupt Zelenskyy elements in the Ukraine are only a small part of his irresponsible spending habits…noted by Fitch.   


With this change in the rating of our Treasury bond’s  we will have to pay investors more to encourage them to buy and cover our excessive spending in the tune of $1.6 trillion —so far.   The increase in bond rates alone caused by our downgrade may cost us billions of dollars extra.  


This is one story the Biden Administration and the pro/Biden media propagandists can not dissemble about—the facts are now out there.  


Though be sure the Democrats  will try to slime the professional and meticulous economists at Fitch…Expect it. 


Friday, July 28, 2023

BIDEN INFLATION —NOTHING TO BRAG ABOUT

…“Republicans may have to find something else to criticize me for now that inflation is coming down…”  President Joe Biden, Auburn, Maine, July 28, 2023 

 Inflation is a general increase in prices and a corresponding fall in the purchasing power or value of money. 


In 2019 I secreted a one-hundred dollar bill in the deep, dark, end-pocket of my bill fold…just for emergencies.  Recently I happened upon that bill.   As I drew  the bill out of the leather compartment, it appeared to me just like any other $100 dollar bill of today.  The familiar blue-green engraving of Ben Franklin peered out over the edge of the leather bill fold. Ben’s characteristic stern look, and his tightly pursed lips made me pause. As the wrinkly image of Franklin slipped beyond the leather, Ben’s  lips seemed to move.  I imagined him saying: ”Watch out citizen, I am not worth what I was three years ago!”   


Franklin, understood inflation. His business was printing and he was also a strong advocate for printed paper money. In 1739 he and his partner produced thousands of bills for the colonies. All went well at first. But Ben, perhaps too eager for business, printed up too many bills, and the result was the predictable threat of too much paper money chasing too few goods and services—rampant inflation. 


Prior to 2021, the USA average inflation rate over the last ten years has been calculated at only 1.9%. (See: Forbes.com Money 1/02/23 “Is Inflation High compared to Years Past? ).    In the 1930s during the Great Depression we even experienced  a period of deflation, when our paper money actually grew in value when demand collapsed and goods and services became cheaper.  Then in the 1970s and 1980s, inflation spiked to unprecedented levels.   After that frightening inflationary period ended, US governments carefully shunned policies which would increase inflation. They were successful.  For the last 40 years inflation has remained very low, often less than 1%. That is— until 2021 when under the Biden Administration inflation reappeared with a vengeance—all as a result of unwise irresponsible and intentional Administration polices.


Recently, as we move into the hyped up political season, we have been hearing from the present Administration  politically driven reassuring noises regarding the economy.  


One of these “reassurances” includes the oft-repeated but misleading statement that the rate of inflation has slowly come downBut a falling RATE of inflation does not mean that somehow prices of goods and services are falling, or that our devalued bills are worth more.  Inflation is cumulative!  Even when the rate is declining prices continue to rise.  Inflation reduces your money’s buying power each year it occurs. It does not go away!


Current US Inflation Rates 200-2023  (See: forbes.com


From 2013 to 2020, annual inflation rates were low, ranging from 0.7% (in 2015) to a high of 2.3% (in 2019) and a near long time average of 1.4% in 2020.  


But after 2020 rates surged under policies instituted by the Biden Administration . 


2021 —Inflation = 7%

2022—Inflation = 6.5%

2023—Inflation = 3%


Total year-over-year inflation is now 16.5%.  That is how much buying power you lost. 


But the inflationary policies and practices which produced high inflation (topping 9% in June 2022) have not changed.  Pumping cash into every nook and cranny of the economy, spending wildly and recklessly, and instituting irresponsible policies which caused higher fuel prices— all generated intense inflationary pressures.  Even the so-called Biden  “Inflation Reduction Act” reduced no inflation— it only pumped more dollars into an overheated economy— increasing the dollars chasing goods and services— which only added fuel to the inflationary fire.  The Biden Administration polices caused a near 17% increase in inflation over their years in office that continues to harm American citizens with sky high prices, which resulted in higher mortgage rates (5.5%) which have chilled 

home sales. Inflation has generated citizen anger and discontent, labor unrest, and general malaise. 


So if you have not had a salary increase in the last three years, you have lost 16.5% in buying power. If you did get a raise of 5%, your are still in a hole, having lost buying power of “only” 11.5%. If you are on a fixed income, or you are living off of savings, your income and savings have shrunk by nearly 17%.  That is what Biden’s economic policy has caused.  


In 2021 the USA median income was just about $70,000.00.  By 2023, that median wage earner lost  close to $12,000  in  purchasing power as a result of inflation.   ( $70,000 x 0.165 = $11,550).    In the real world of purchasing power that “median” $70 k wage earner was only  ($70,000-$12,000=$58,000) about $58,000.  


That is why we all feel so economically “pinched” when we pay our bills at the grocer or gas station.  


 Or another way of looking at this is that the Biden administration dipped into your pocket book and your weekly salary envelope and took away nearly 17%, or (for the median wage earner) about $12,000, of hard earned purchasing power in the few years he was in office.  You should be very angry.   


As a result, we should not feel any sense of reassurance that all is well with our economy, and certainly no reassurance at all regarding the probity and wisdom of those who control the levers of power of the state.


Sunday, July 16, 2023

EL NINO SUMMER BRINGS UNUSUAL WEATHER

 The summer of 2023 so far, has been unusual. “Warm and sticky” might be a two word description. The unstable air created  beautiful cloud patterns reminiscent of Puerto Rico, or Ireland, but very unusual for Long Island. The white cloud masses rose up each day into giant towering thunderheads, (Cumulonimbus ) then the sky darkened and heavy showers followed. This is a sure indicator that the air is heavy laden with moisture.  

Looking back, winter was very mild too, except for one record shattering cold day, that froze my friend Gus’ beloved fig trees. Spring also arrived early, and was brief—someone called it “ephemeral”.  Spring season quickly morphed into deep summer—but it did so in late May.   Calendrical summer did arrive on June 21, but it was hot and humid, more like August than June.   Each day opened with persistent 99% relative humidity which fed the daily  thunderheads.  Other unusual occurrences: the Goldfinches never arrived, nor did the hummingbirds. Our sticky, red and drippy “hummer” feeders dangled in the hot sun as ignored as was our our well-planned and tediously tended flower beds, now burgeoning with red blossoms—planted just for this species.   Where are they?  With this weather the hummingbirds probably found so much nectar sources further south, they never bothered to come north to our place. 

So what’s going on? 


Climate fanatics love to mix up climate and weather.  Some continued  to blame the summer’s heat and humidity on “Global Warming”, a climatic phenomenon.  But climate and weather are distinct and very different sciences.  Weather is highly varied and that variability is still poorly understood.  Are the weather phenomena we experiencing simply natural variability in weather—or is it related to a warming planet? We do not know.  Smudging up the difference between the two simply ignores actual causes—aspects of the atmosphere that must be understood to be addressed.  


Though human-caused climate warming is real —it is not the sole cause of every unpleasant event in our universe.  Meteorologist conclude that our  strange summer of 2023 is 99% a weather phenomenon——called the equatorial oscillation  or El Niño!


So we are experiencing an El Nino event  of the equatorial region.  Over a period of from 3-7 years La Niña weather tends to cycles through to El Nino.  El Nino weather is generally shorter, sometimes lasting only about a year.  La Nina events last longer. 


The last El Nino we experienced here was in 2014 -2016 when records were set for the warmest years on record. A “neutral” period intervened but, since 2019 we have had three successive La Nina years.   But 2023 has arrived with what seems a strong  “El Nino”. 


https://www.climate.gov/news-features/blogs/june-2023-enso-update-el-niño-here.


The term El Niño (“the little one”) is derived from observations Peruvian and Ecuadorian fishermen made concerning their fishing success. They noticed that on some years,  around Christmas—(the birth of Jesus when “El Niño” arrives) Pacific sea water temperatures rose sharply..and fishing went bad.   


In most years cold water up wells from the deep, off the the Pacific east coast of Ecuador and Peru. The upwelling of cold deep water brings nutrients from the depths and microscopic sea life to feed on it. Fish follow. But some years around Christmas (or the arrival of “El Nino”) the ocean was capped with warm sea water, no upwelling, and  no fish. 


What caused the warm water arrival? What are the weather impacts of El Nino? 


El Nino event of this year began with the arrival of a great flood of equatorial warm water which pooled up off the west coast of Ecuador and Peru close to the equator.  


Today (7-15-‘23) sea water surface temperature in that equatorial region where the Galapagos Islands occur is exactly 78F.  That temperature is about 5 degrees higher than it was last year on the same date.  Seventy-eight degrees Fahrenheit (78F) is a pleasant  temperature for human swimmers and desirable pool/water level, but is not good for sea water, or fish.   The oxygen content of water, or oxygen saturation, drops off as water temperature rises. Since warm water is less dense than cool water, warm water at  the surface creates a stable temperature situation which inhibits mixing of the top warm layer with cooler layers below. 


The warm top layer soon becomes deficient in oxygen. Nutrients quickly get used up, and can not be replaced.  And in a  very short time  the sea off Ecuador and Peru becomes almost barren of life.  


Why does the water warm arrive? 


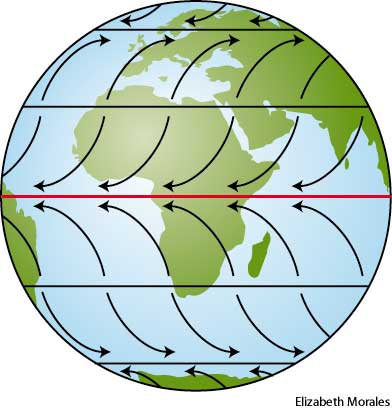
In the eastern Pacific off the coast of Peru and Ecuador,  the North East Trade Winds and South East Trades,  major elements  of the Earth’s global winds circulation pattern,  flow west toward Japan.  See Trade Winds  The constant flow of air over the water “pushes water in that direction” and tends to create a surface current which moves Pacific surface water at the equator west toward Japan.  This flow of water toward Japan causes the desirable upwelling of cold deep water along the coast of Ecuador and Peru.  This upwelling is the source of those nation’s  wealth in fish resources.  Simply stated it is the Trade Winds which  push warm surface water toward Japan. 


During the last three La Nina years we have had strong Trade Winds or northeasterly winds near the equator. These winds have effectively pushed warm equatorial water WEST over these last years to accumulate and “pile up” IN THE EAST PACIFIC OCEAN off of Japan, the Philippines and Indonesia. Warm water has accumulated  there for three years now.  


During the La Nina years  2014 -2016 these constant northeast winds have caused sea levels to rise off Japan by 20 cm, or almost 8 inches.  


During a La Nina years warm water piles up in the western Pacific.  Eight inches in height seems a very minimal slope when measured over the 9,000 mile wide Pacific but even small forces can move liquids like water very effectively. As a result of less powerful Trade Winds and this higher level of warm water on the Japan side of the Pacific and lower on the Ecuador side…warm water has flowed back east this year…and brought on an El Nino.  The Trade Winds push water west toward Japan, cause upwelling and La Nina effects, then when the winds weaken the water flows back to produce the El Nino effect.   


 During an  El Nino  annual event very warm sea water collects  off Ecuador, SA and surrounds the Galapagos Islands. It stagnates there, warming the air and raising the level of moisture in the air.  


This pool of warm water has a great effect on the global wind circulation. Global winds generate the jet streams which initiate and guide cyclonic mid-latitude storms. See: Jet Streams


During an El Nino event the warm water pool in the Eastern Pacific tends to drag the Mid Latitude Jet Stream (MLJS) south closer to the equator, displacing it from a more northerly position. https://www.noaa.gov/jetstream/enso_impacts El Nino’s displaced jet also causes higher temperatures in some places, floods in others and severe  droughts in other areas.  Weather patterns are responding to a jet steam that is out of its “normal” pattern or where we would expect it to be.   


Under El Nino circumstances the Mid Latitude Jet stays more southerly. In this location it picks up moisture from the Pacific and moves it east. The result is higher temperatures and more moisture in the air over Texas, the Gulf States, southern USA and parts of the Mid Atlantic States.  As the jet swings out over the Atlantic it also tends to suppress Atlantic Hurricanes.   But its effects in the west, is to intensify Pacific hurricanes or typhoons.   


In the USA we should expect  wetter than average conditions all along the Gulf Coast and possibly along the east coast. And expect  the Pacific Northwest and the Ohio Valley regions to be cooler and drier than normal. 


If El NIno hangs around till winter, we will discuss the weather effects of a winter  El NIno.  

https://www.climate.gov/news-features/featured-images/how-el-niño-and-la-niña-affect-winter-jet-stream-and-us-climate

Tuesday, July 11, 2023

OSPREYS (PANDION) APPEAR TO TEACH YOUNG TO FLY AT SELECTED LOCATIONS

 Ospreys may bring their young to a particular site to teach and practice flying. 

The Osprey or “fish hawk”,  Pandion haliaetus  https://en.m.wikipedia.org/wiki/Osprey has returned to our local area in force. At the present time (July 2023) there are two successfully occupied nests at the shores of Mount Sinai Harbor on L.I., Suffolk County, New York. (https://earth.app.goo.gl/PW3giC)  One of these nests was located on a post and platform affair constructed by the Town several years ago in the Harbor’s extreme west end, and another was chosen and constructed by Ospreys on the top of a wooden utility pole along the road-side of Harbor Beach Road. 


An avid Osprey observer of these local nests close to water I was quite surprised to see an Osprey family (adult male and female with a single immature bird )frequenting the top of a high tension electric utility pylon, more than two miles inland from known nest sites and similarly distant from the ocean, Long Island Sound, or large bodies of water where these birds are normally observed. 


The pylon where these observations were made is situated  at: 40 56’ 37’’ N, 72 59’ 20’ W, at the intersection of Miller Place Road, and the former LIRR right-of-way (recently developed as a bicycle and pedestrian pathway, and locally known as “Brookhaven Town, Rail Path”).  The high tension electric pylon with an array of wireless nodes or repeaters which encircle the top is well over 150 feet above ground.    This pylon is approximately  1.5 miles from Long Island Sound, 2.2 miles from Mount Sinai Harbor Osprey nests, and 2.1 miles from a large artificial lake near Middle Island, and 3.3 miles from “Twin Ponds”  two small, inland, natural ponds. This Osprey family was far from their normal fishing and nesting sites.  So why where they there? 


On at least four occasions, this summer I have observed what I assumed to be a mated Osprey pair and a juvenile of that species, occupying the area over one particular pylon.  The three were observed soaring over the immediate area near the pylon—where summer thermals are common. The immature bird often lands on the top of the pylon and calls plaintively and repeatedly to its parents, who then fly over the top of the pylon and continue on into in a spiral soaring flight. When they pass they call to the juvenile. On several occasions they landed on the top of the pylon among the many microwave and wireless nodes installed on this particular pylon to join (and calm?) the complaining juvenile. I can not be sure that the observations were of the same mated pair and their young on each occasion. The parents do not often perch, but appear to swoop down and encourage the juvenile to fly.  The group remains at the site around the pylon for a period of time, then all depart together..to areas unknown.  


The Pylon they have been seen to visit on these occasions is distant from any water sources. However, several large parking lots and shopping plazas in the immediate vicinity may encourage the formation of local thermal currents. Perhaps they visit the site, with their young to practice flying. The area of observations is two miles inland from the Sound shore, where cool water and sea breezes retard thermal activity and tend to minimize their strength. On warm clear days abundant thermals near this site with its elevated comfortable perch provides adequate up ‘lift’ for these magnificent flyers to soar, and circumstances where they can “teach” their youngsters to fly—and perhaps to build adequate wing and breast musculature for the fall, when they will have to migrate long distances to southern latitudes.  In addition, the large array of wireless equipment at the top permits many places to perch…another possible advantage. 


Update: On July 28, 2023 this author observed a single juvenile Osprey flying to and perching on the pylon described above.  The juvenile made a few plaintive calls as if parents were near, but no other osprey were present. I observed the juvenile for about 1/2 hour. The time was about 10 AM, light winds, clear sky.